
Trading Setups in Market Technique
Trading setups in market technique are rule-based entry scenarios in the direction of the trend: the point 2 trade, the entry in the correction and the fuzzy entry.
Approx. 5 min read · Updated October 9, 2026
The setups described here focus on trend trading: in the view of market technique, trading with the trend achieves better hit rates than other entry signals. In addition, every setup enters the market out of a correction that has formed on the higher timeframe. The basics – points 1-2-3 and the combination of the higher timeframe and the signal timeframe – are explained in the article on market technique.
Three entry scenarios are distinguished. In all of them, the aim is to enter in the direction of the higher-timeframe trend from as deep in the correction as possible. In every case, the correction must have retraced at least 50% of the preceding movement; smaller corrections are not traded.
1. Point 2 trade
In the P2 trade, you trade the break of point 2 on the lower-order signal timeframe in the direction of the trend. P2 is particularly significant because many market participants' orders come together at this point on the chart. Orders cluster here from traders who…
- …have their stop orders there,
- …want to open a position,
- …want to reverse their position.
As a result, price often moves very quickly and strongly at P2. Sometimes there are even chain reactions, because market participants do not all place their stop orders equally close to the key chart levels: as one stop after another is triggered, the movement accelerates sharply.
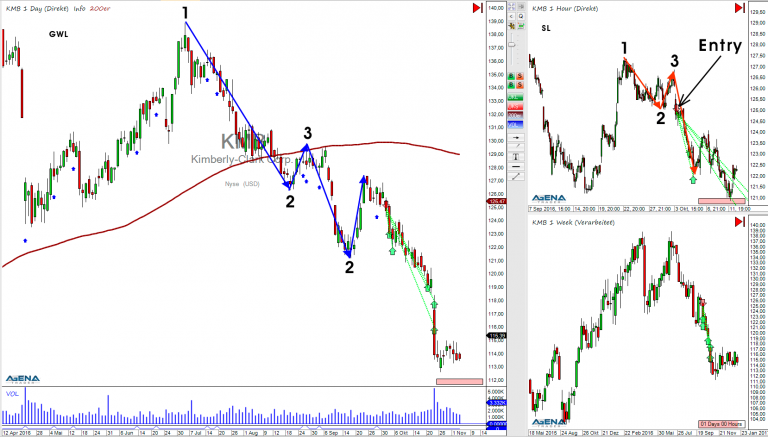
The chart shows a classic P2 trade. On the left is the higher timeframe with the market-technique point count; on the right is the signal trend size, which has also been marked with a point count. The position was opened at P2 of the signal timeframe, as it was reasonable to expect the higher-timeframe trend to continue from there.
2. Entry in the correction
With an entry in the correction, it is important to note that this refers to the correction of the signal trend. Both the higher timeframe and the signal timeframe are therefore in a correction. In other words, a trend in the direction of the main trend has already formed on the signal timeframe as well, since its P2 has already been broken – and this signal trend is now itself in a correction phase.
There are three variants of the entry in the correction:
Outright entry
With an outright entry during the correction phase, traders usually wait until the first signs of weakness appear. If prices only retrace hesitantly, the entry can be made at any point until the last P3 of the lower-order trend has been broken. With this variant, you enter the market straight away with the full planned position size.
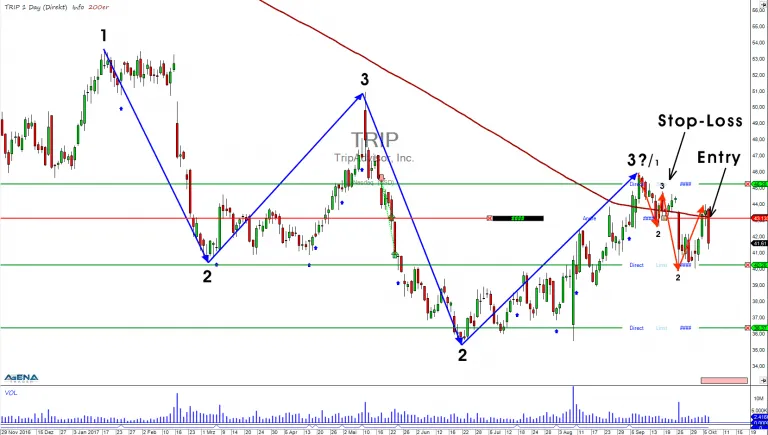
The following chart illustrates such an entry in the short direction. The higher timeframe is shown in blue, the signal timeframe in orange. The market-technique point count is also shown for both the higher timeframe (large numbers) and the signal timeframe (small numbers). The stop-loss is placed at the last point 3 of the signal timeframe.
Scaled entry
It is usually difficult to get into the market so precisely that you catch the extreme of the correction phase – in a short trade, its high. Since you do not know exactly when the market will turn back in the direction of the trend, this variant involves placing several limit orders in the market and being filled into the position step by step. In line with sound money management, the overall risk must not be overlooked: the combined risk of the individual limit orders must not exceed the total risk planned for the trade. With this entry, you often end up with less than the planned position size, because only some of the limit orders are filled.
The previous chart can also be used to illustrate this variant: instead of a single order, the position could have been built up with several limit orders.
Reversal-bar entry
When a trend already exists on the signal timeframe, you can also try to enter the market with a reversal bar – a price bar that first extends the correction but then turns and closes firmly in the direction of the trend. It is a clear sign that the signal trend is moving back in its original direction.
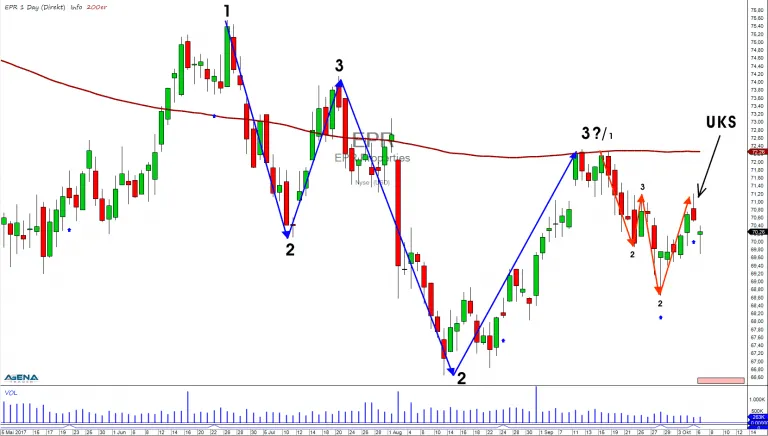
The chart below illustrates this entry variant. Both the higher timeframe and the signal timeframe have already formed a trend. The reversal bar adds further confirmation to the setup, as it raises the probability of a successful trade. Alternatively, you could have entered earlier, at P2 of the signal trend, and used the reversal bar to add to the position.
With reversal bars, make sure that the timeframe you are looking at is not too small: the smaller the timeframe, the less significant the reversal bar. Reversal bars on the daily chart carry particular weight.
3. Fuzzy entry
The fuzzy entry gets its name because you do not wait for a signal on the signal timeframe. Instead, you enter directly on the higher timeframe once the correction has retraced almost 100% of the previous movement. Unlike the other two setups, this one does not combine two trend sizes.
The fuzzy entry is a very risky setup, because the position is opened exactly where other market participants could be forced to act. In real trading, it often happens that the last P3 of the higher-timeframe trend is briefly tested before prices move back in the direction of the trend. As stop orders are often placed at exactly this point, they may be triggered by such a brief move (stop hunting). For this reason, this setup should only be chosen if the preceding correction was very sluggish or, ideally, a reversal bar has formed.
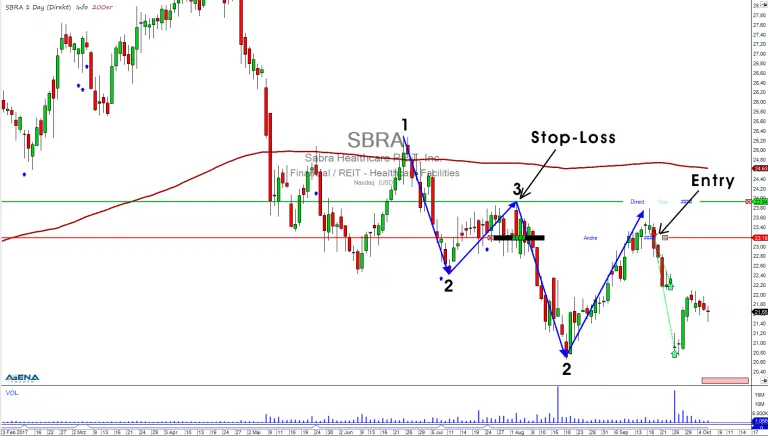
The following chart illustrates the fuzzy entry. The higher-timeframe trend (in blue) has corrected by 100%. It would also have been possible to enter directly at an even higher level. In this case, however, the position was entered after a reversal bar had formed, with the entry triggered just below the reversal bar. With a fuzzy entry, the stop-loss is placed at the last point 3 of the higher timeframe, because you are trading the higher timeframe directly.
Cashback angle
Cashback is paid on every lot you trade – up to $4.40 per lot at RoboForex.
Get deal** Affiliate link (advertising)
More terms.
- Stop Rules in Market TechniqueRules for placing and trailing stops purely on the basis of chart structure – beyond the last point 3 when trading the trend, or at the last candle's high or low when trading the movement.
- Dow TheoryThe Dow theory, developed by Charles H. Dow in the late 19th century, holds that prices move in trends. Its tenets are the foundation of modern technical analysis.
- Risk-Reward RatioThe risk-reward ratio compares the potential profit of a trade with the risk taken: the distance from entry to price target versus the distance from entry to stop-loss.
- Money ManagementMoney management is the set of rules that determines how much capital a trader invests and risks per trade and in total, with the aim of protecting the account from large losses.